The Biomechanics of Being a Tall Runner
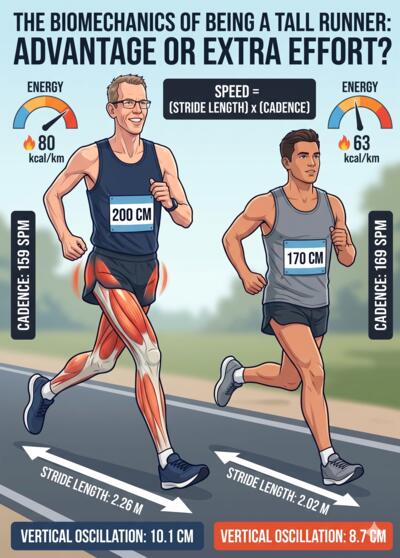
- Tall runners take fewer, longer strides at any given pace — across the four well-sampled height groups: cadence drops by ~8 spm (171 → 163) and stride length increases by ~9% (1.95 → 2.13 m).
- Tall runners naturally settle around 155–165 spm — chasing the common 180 spm target would shorten strides without improving efficiency.
- The longer strides cost more energy: the taller runners move ~23% higher per step (8.2 → 10.1 cm vertical oscillation), increasing metabolic cost.
I am 200 cm tall and started running around seven years ago. I wanted to know if being tall really is an advantage — a common assumption. Longer legs mean longer strides, and that part is true. But there is also the question of how much more effort it takes to move longer legs and a heavier body.
Since, like many, I record my runs on my watch I have precise data. To compare against runners of different heights, I used the Ferber et al. Running Injury Clinic dataset,[3] which contains treadmill biomechanics data from 659 sessions across 436 runners collected at the University of Calgary between 2009 and 2017 (651 after filtering). It is one of the larger open datasets of running gait. Comparing my 767 road runs against those 651 treadmill sessions gave me a cleaner picture of where height actually helps — and where it costs you. I also have several trail runs, but those are kept separate: trail running involves much more elevation gain, slower pace, and different gait mechanics, so mixing them with the Ferber treadmill reference would confound the comparison.
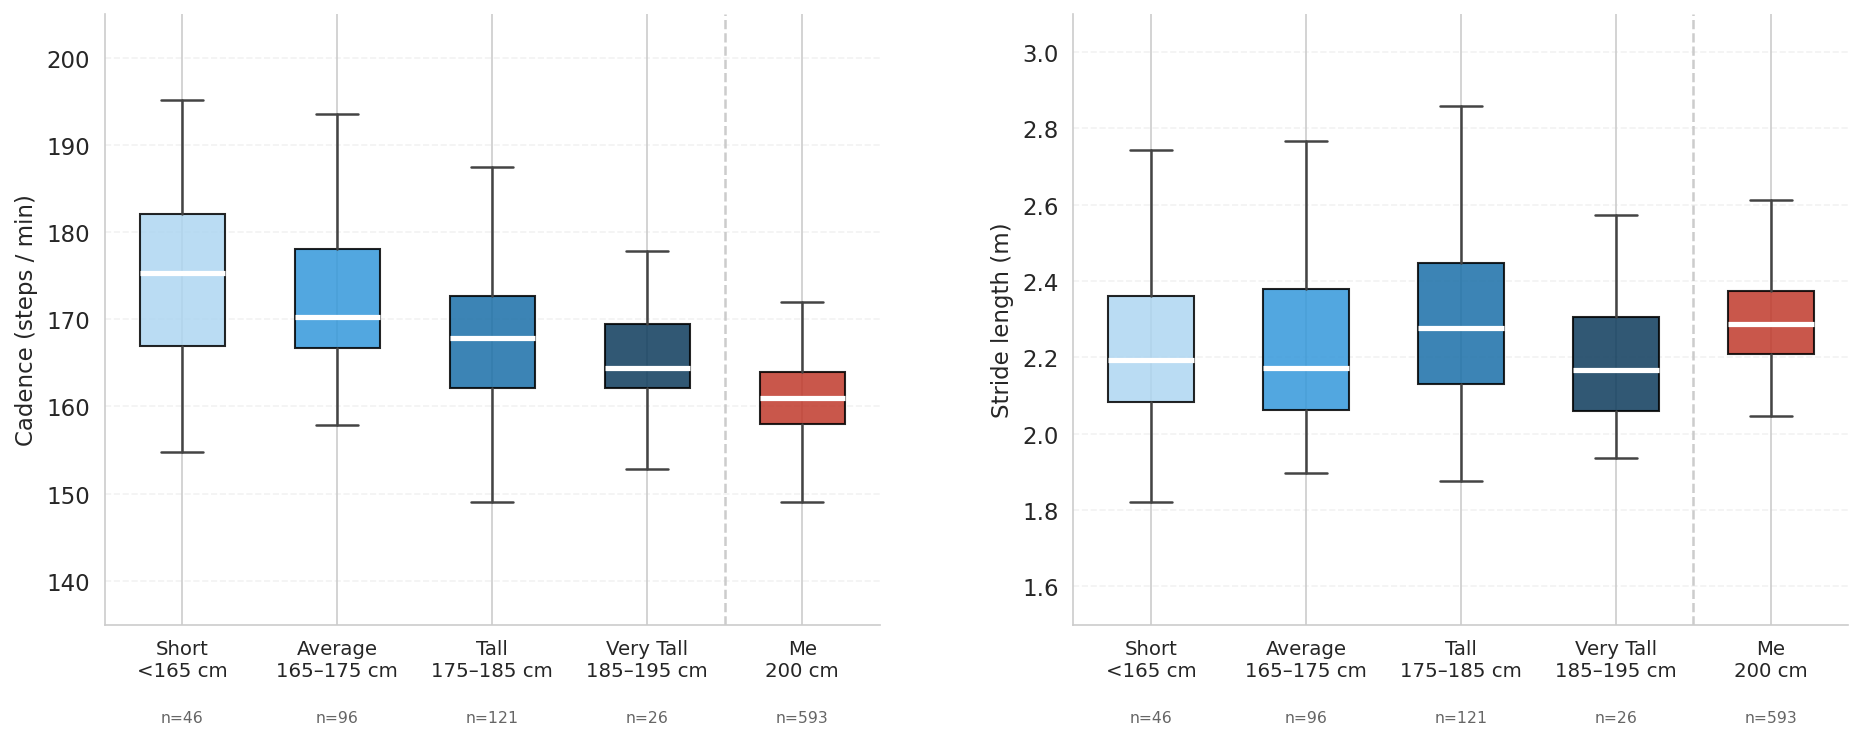
Figure 2 shows the cadence decline with height is consistent across all groups. The stride trend is positive overall but less uniform — the Very Tall group dips slightly below Tall (Table 1 has the exact values; the partial correlation controlling for speed is r = 0.30, discussed below).
The fundamental equation
Running speed is mechanically determined by two things:
You can go faster by taking longer strides, by taking more strides per minute, or both. Tall runners naturally favour the first lever. The question is what happens to the second.
- Step
- One footfall: left foot to right foot (or vice versa). This is what Garmin calls "stride length" in its exports — exported in centimetres.[4]
- Stride (biomechanical)
- One complete gait cycle: left footstrike back to the next left footstrike = two steps. This is the convention used in the scientific literature, including the Ferber dataset.[3] All stride length values in this article use this definition.
Cadence and stride by height group
The dataset provides 651 sessions from 431 runners across a wide height range (quality data: healthy subjects, see Methods). Table 1 summarises the group averages; the cadence and stride trends visible in Figure 2 are confirmed numerically here.
| Height group | n | Avg speed (m/s) | Avg pace (min/km) | Cadence (spm) | Stride length (m) |
|---|---|---|---|---|---|
| Short (<165 cm) | 132 | 2.78 | 5:59 | 171.3 | 1.95 |
| Average (165–175 cm) | 241 | 2.84 | 5:52 | 168.7 | 2.02 |
| Tall (175–185 cm) | 231 | 3.01 | 5:32 | 165.3 | 2.19 |
| Very Tall (185–195 cm) | 43 | 2.89 | 5:46 | 163.0 | 2.13 |
| Extra Tall (≥195 cm) † | 4 | 3.63 | 4:35 | 163.7 | 2.66 |
| Me (200 cm) | 767 runs | 3.01 | 5:32 | 159.3 | 2.26 |
† n = 4; shown for completeness but excluded from statistical comparisons due to sample size.
For Ferber groups, n counts treadmill sessions (431 subjects total; some contributed more than one session at different speeds). For Me, n counts outdoor road runs from one person.
There is a clear trend: at racing speeds (2.8–4.0 m/s, ≈ 4:10–5:57 min/km), a Welch t-test comparing the Average group (165–175 cm, n = 96) against the Tall group (175–185 cm, n = 121) shows statistically significant differences in both cadence (−4.8 spm, p < 0.001) and stride length (+0.08 m, p = 0.009), visible in Figure 3. Extending the comparison to the Very Tall group (185–195 cm, n = 26) shows a larger cadence gap (−7.1 spm, p = 0.001), though stride length does not reach significance at this smaller sample size (p = 0.52) — the same sampling noise that drives the dip visible in Figure 4. Across the full dataset, height and stride length correlate positively even after controlling for speed (r = 0.30, p < 0.001), confirming the trend holds. The cadence effect is robust and detectable even in smaller groups.
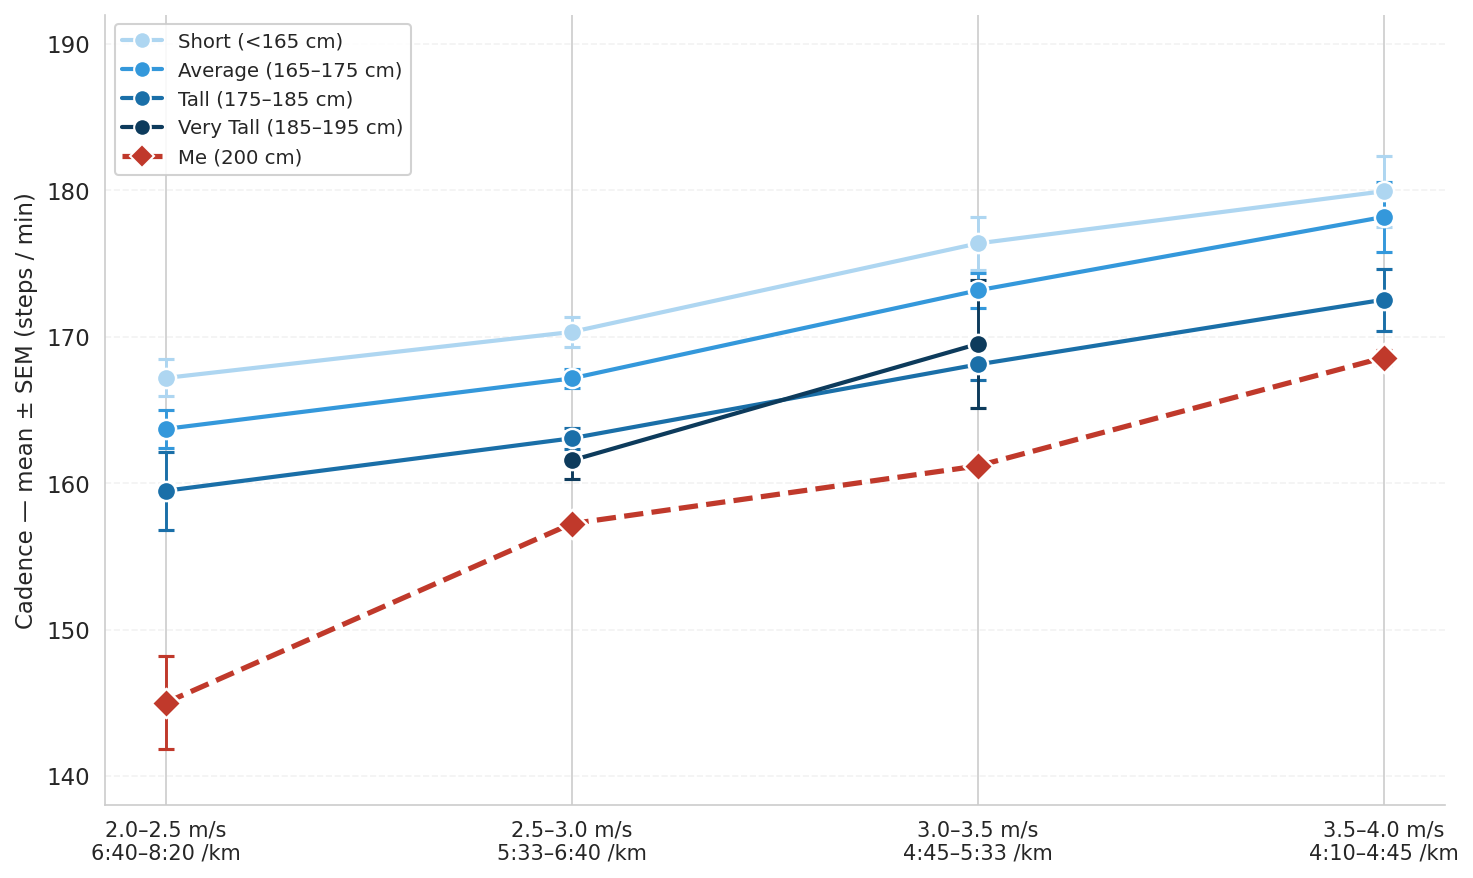
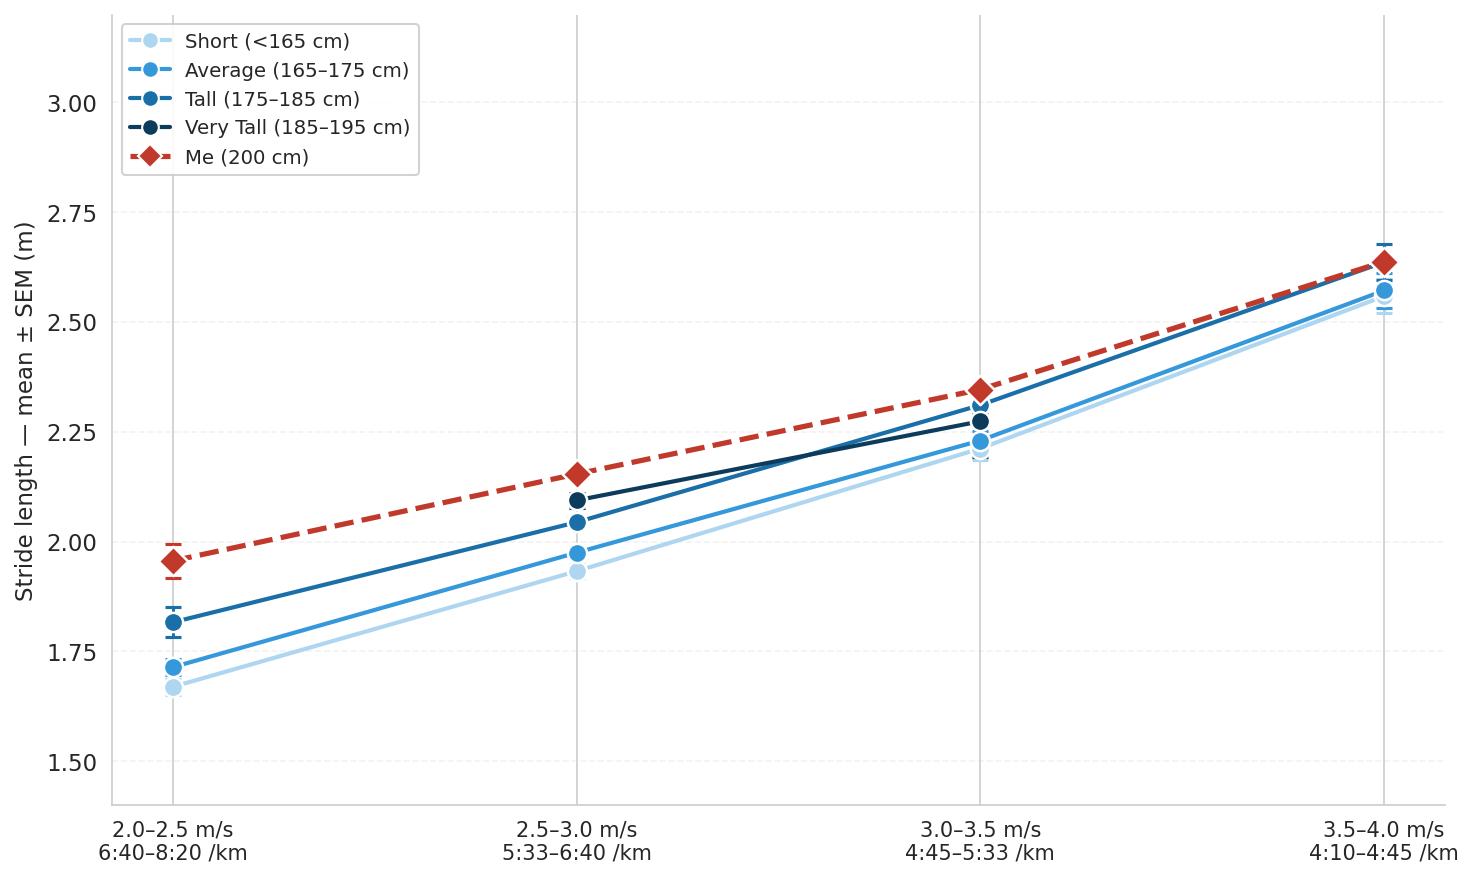
My own numbers fit the pattern: 159 spm cadence and 2.26 m average stride, compared to the dataset mean of 168 spm and 2.08 m. Running at about the same average speed (3.01 vs 2.87 m/s, ≈ 5:32 and 5:48 min/km), I achieve it with fewer, longer steps.
So tall runners are faster?
We cannot conclude that from the data. Speed comparisons across groups need context: the Ferber runners set their own treadmill pace, and my data mixes outdoor runs of different effort levels — easy runs, tempo sessions, and races. What the data does support is that taller runners take fewer steps per minute and cover more ground per step — consistently across speeds.
But longer strides (2.26 m vs 2.01 m for average runners) come at a cost. Each step lifts a larger body mass against gravity. Limbs are longer, so the rotational inertia of each leg swing is higher — leg-swing cost scales roughly with the fourth power of stride frequency, and longer legs with greater moment of inertia swing at higher cost.[1] Muscles have to produce force over a longer range of motion. The metabolic cost of running scales roughly with body mass,[2] and the mechanical work done against gravity per stride is simply m × g × Δh — it scales with both mass and how far the centre of mass travels vertically each step. Taller runners oscillate slightly more (the Ferber dataset shows vertical oscillation of 10.1 cm for runners ≥195 cm vs 8.2 cm for runners <165 cm).[3]
In practice, tall runners achieve competitive speeds, but carry a higher absolute energy cost per kilometre. My Garmin data shows 80 kcal/km (measured); Figure 1 shows ~63 kcal/km for a 170 cm runner, estimated using mass scaling with assumed body weights.[2] The exact figure depends on those assumptions, but the direction is clear: a heavier body costs more to run.
The height–cadence relationship holds at the elite level too. Among marathon world record holders, Kipchoge (167 cm, ~185 spm at Tokyo 2020) and Kiptum (180 cm, ~187–192 spm at Chicago 2023) confirm it;[6] current record holder Sawe (1:59:30, London 2026)[8] has no published biomechanics data. In sprinting, the pattern is the same: Bolt (195 cm) averaged ~257 spm with ~2.44 m per step at the 2009 World Championships; Gay (~178 cm) ran at higher cadence with similar stride.[7]
What this means in practice
A few things I have taken from this for my own running:
- Do not chase higher cadence blindly. The widely cited 180 spm heuristic originated from Jack Daniels' personal observations at the Olympics[5] — elite distance runners who are typically not 200 cm tall. For tall people like me, a cadence of ~159 spm is mechanically appropriate for my leg length and running speed. Artificially increasing it would shorten my strides without necessarily improving efficiency.
- Stride length is a strength. It is tempting to interpret a low cadence as underperformance - the data says it is a consequence of geometry, not laziness.
- Energy cost matters more per kilo than per kilometre. Tall runners need to take care of aerobic base and fuelling on longer efforts, because the absolute caloric demand is higher even at moderate pace.
Methods
Personal data
767 road runs recorded between January 2020 and May 2026. Activities were quality-filtered: distance > 3 km, average cadence > 100 spm (to remove GPS drift artefacts), and average stride > 1.0 m after conversion. Treadmill and trail runs were excluded from the main analysis.
Ferber dataset
651 sessions from 431 healthy subjects collected at the University of Calgary between 2009 and 2017 using 3D motion-capture treadmill running.[3] Quality filters removed sessions with speed outside 1.0–6.0 m/s, cadence outside 120–220 spm, height outside 140–220 cm, and statistical outliers (>3σ on speed, height, and cadence). The dataset is openly licensed (CC BY 4.0).
Garmin stride conversion
Garmin exports Avg Stride Length in centimetres as a single step (left foot to right foot), whereas the scientific convention — including the Ferber dataset — defines stride as a full gait cycle (left footstrike to the next left footstrike = two steps).[4] To align the two: stride_m = Garmin_cm ÷ 100 × 2. Without this correction, Garmin reads ~1.1 m while Ferber shows 1.6–2.6 m for the same runners — a factor-of-two gap that is purely a naming difference.
Statistics
Group comparisons used Welch's t-test (unequal variances assumed). Correlations are Pearson r. Speed bands (2.8–4.0 m/s, ≈ 4:10–5:57 min/km) were used to control for pace when comparing height groups.
Conclusions
The height–cadence relationship is not noise. It holds across both datasets, and the statistical tests are robust enough to be confident in the direction: taller runners take fewer, longer strides. The energy penalty follows directly from geometry — more mass moving further vertically per stride — not from technique or fitness.
For tall runners the practical reading is simple. A lower natural cadence is not a deficit. The 180 spm target was derived from a population that does not include 200 cm runners, and applying it mechanically would sacrifice the one biomechanical advantage height actually gives.
Caveats. The Ferber dataset uses treadmill running at self-selected speed; its biomechanics are precise but its speed distribution does not reflect competitive conditions. The comparison with personal outdoor data is observational, not controlled. The Extra Tall group (≥195 cm) has only four subjects — the dataset does not extend to runners at 200 cm, so individual comparisons are extrapolations at the boundary. Personal road data includes modest elevation (0–619 m ascent per session, median 149 m); hillier runs show a small but significant stride-shortening effect after controlling for pace (partial r = −0.09, p = 0.009) that has no counterpart in the treadmill reference.
References
- Doke J, Donelan JM, Kuo AD. Mechanics and energetics of swinging the human leg. J Exp Biol. 2005;208(Pt 3):439–445. doi:10.1242/jeb.01408
- Alexander RM. Models and the scaling of energy costs for locomotion. J Exp Biol. 2005;208(Pt 9):1645–1652. doi:10.1242/jeb.01484
- Ferber R, et al. A biomechanical dataset of 1,798 healthy and injured subjects during treadmill walking and running. Sci Data. 2024;11:1232. doi:10.1038/s41597-024-04011-7
- Garmin. What is the Stride Length Feature Found on a Garmin Watch? Garmin Customer Support. support.garmin.com (accessed May 2026).
- Marathon Handbook. Running cadence demystified: why 180 isn't magic and what actually matters. marathonhandbook.com (accessed May 2026). Covers the origin of the 180 spm rule (Jack Daniels' Olympic observations) and evidence that height is a significant predictor of natural cadence.
- Hasegawa H, et al. Footstrike Pattern and Cadence of the Marathon Athletes at the Tokyo 2020 Olympic Games. Appl Sci. 2023;13(11):6620. doi:10.3390/app13116620. Kiptum cadence: Movaia Running Form Analysis. movaia.com (accessed May 2026).
- Čoh M, et al. A kinematics analysis of three best 100 m performances ever. Monten J Sports Sci Med. 2013;2(1). PMC3661886. Based on the IAAF Berlin 2009 biomechanics project data.
- World Athletics. Sawe smashes two-hour barrier as Assefa sets women's world record at London Marathon 2026. World Athletics News. worldathletics.org (accessed May 2026).