myrun: a self-hosted training dashboard
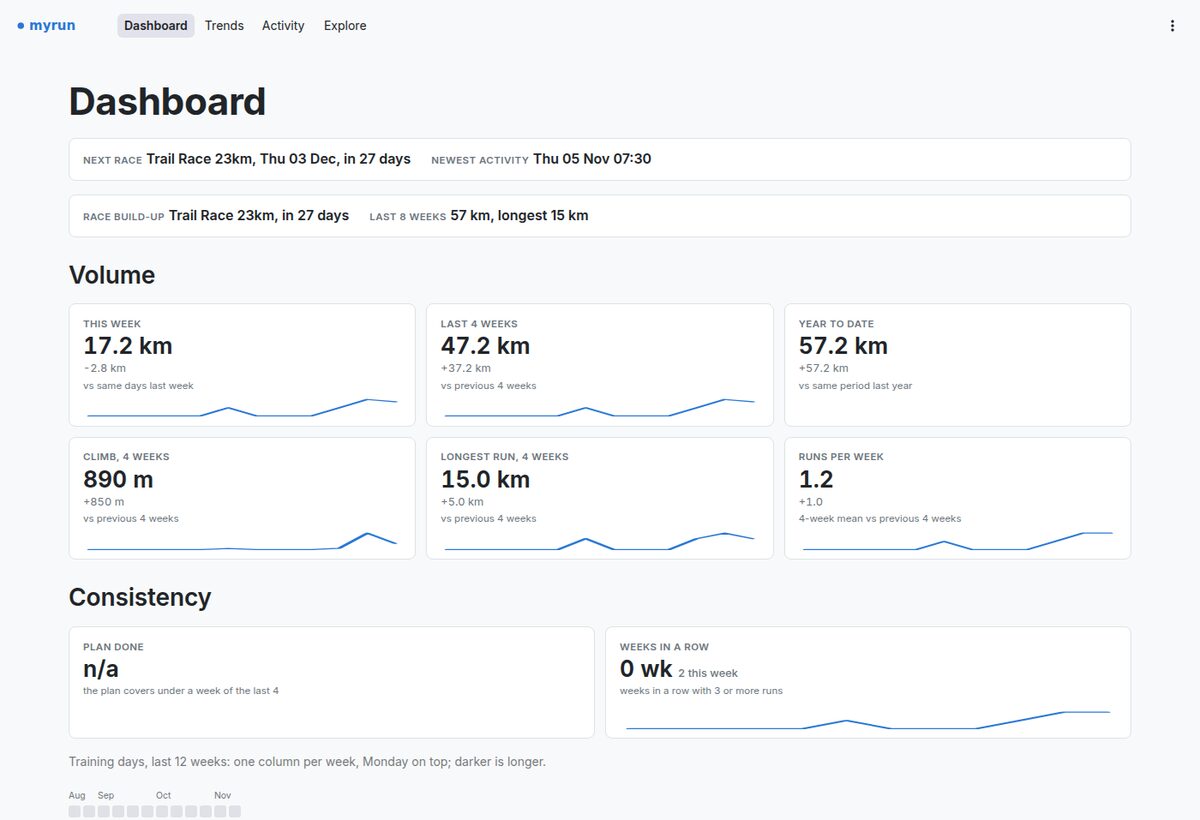
A dashboard for runners who already keep their data in statistics-for-strava. myrun reads that tool's SQLite database, adds a few optional files (wellness, training plan, races, Garmin metrics), and answers four questions in a Streamlit app: how is my training going, how is it trending, what happened in this run, and what relates to what.
Who it is for
Runners who already self-host statistics-for-strava and want more analysis than it gives, without sending data to another service. It never contacts Strava or Garmin, so it needs no API keys. It has no login of its own: keep it on localhost or behind a reverse proxy that authenticates. I built it for my own training, and it has been tested mostly against my data and a synthetic demo set. Expect rough edges.
What it does
Dashboard
Cards for volume, load and fitness, and recovery, each against the previous period. A run streak, a 12-week calendar, the build-up to the next race compared with the same point before a similar one, and weekly load and kilometres against the plan.
Trends
Aerobic efficiency, volume, best efforts, shoe mileage and races over time, plus running dynamics when Garmin data is added.
Activity
Heart rate, pace, elevation and cadence for one run, time in zones, heart-rate drift, laps, and an overlay with another run.
Explore
Any metric against any other, per run or per kilometre, grouped by hour of day, temperature, surface, climb and more.
Every number comes from a function in the myrun Python package, so the same data is one import away in a notebook.
How it works
- The statistics-for-strava database is opened read-only; it is the only required input.
- Four optional inputs add panels: daily wellness (Parquet), a training plan (CSV), a race log (CSV) and Garmin activities (CSV or Parquet). Leave one out and its panels disappear. Garmin activities are matched to Strava activities by start time.
- Load is Strava's relative effort; activities without it are not counted, and the page says how many.
- Per-kilometre heart rate is computed from streams and cached, so the first visit to that view is slow.
- Everything is configured in one YAML file; unknown keys are an error.
Stack: Python 3.12+, Streamlit, pandas, Plotly, SQLite, Parquet, Docker, tests built on a synthetic database.
Run it
Requires Python 3.12+ and uv. To try it on synthetic data, no Strava account needed:
For your own data, copy config.example.yaml to ~/.config/myrun/config.yaml and set strava_db to your statistics-for-strava database. A Dockerfile is included; the README has the volume mounts.
MIT licensed. Not affiliated with Strava, Garmin or statistics-for-strava.